
Many of the titans of American foodservice can only hope that their latest completed fiscal years as revealed in the 37th edition of Nation’s Restaurant News’ Top 100 census become the low points they use for unfavorable comparisons for years to come.
NRN’s annual three-year look at the unit development and sales performance of the 100 largest foodservice chains, as ranked by annual U.S. systemwide sales, paints a picture of an industry whose forward motion not only sputtered to a halt for the first time in recent memory, but teetered precariously on the precipice dividing progress and regress. In their latest finalized fiscal years, the Top 100 chains generated an aggregate $205.68 billion in domestic systemwide sales, compared with $205.77 billion in their preceding 12-month reporting periods.They had achieved 3.98-percent aggregate sales growth in the preceding year.
The separately tracked Top 100 companies, which are ranked on the basis of U.S. foodservice revenues from company-store sales, franchise sales royalties and initial fees, fared little better. But at least the Top 100 companies tilted in the preferred direction as they, as a group, had latest-year aggregate domestic foodservice revenue of $121.10 billion, versus preceding-year aggregate revenue of $121.08 billion.
In the preceding year the Top 100 companies, collectively, had achieved 10.96-percent growth in revenue.
Performance issues and challenges among chains and companies were many, as illustrated in the statistical tables, charts and graphs anchoring the Top 100 special report and the companion Second 100 analysis to be published in NRN in late July.
New to the Top 100 this year are two large tables that provide market share and estimated sales per unit information for the various concept peer groups, or segments, covered by the report, as well as at-a-glance insight into how the entire Top 100 roster fared in those areas.
Counting up industry ills
The results of Top 100 and Second 100 chains are an important indicator of industry health, as their combined $235.47 billion in sales in the latest year gives them a nearly 41-percent share of the $580 billion the National Restaurant Association is estimating all U.S. foodservice operations will take in during 2010.
Recent reports by some publicly traded restaurant companies and stock analysts indicate that while some quick-service operators are facing slowing U.S. sales tied to pervasive, relatively high rates of unemployment, some casual-dining chains are seeing improved quarterly same-store sales after nearly two years of bad news.
It remains to be seen, as more second-quarter results are released in the weeks ahead, if same-store sales for a variety of concepts will improve after the results for many for the first three months of this calendar year were marred by extreme weather or flooding. The abnormal weather and resulting sales disruption have made it difficult for some analysts to gauge how strongly the industry is bouncing back.
Five Guys hits the big list
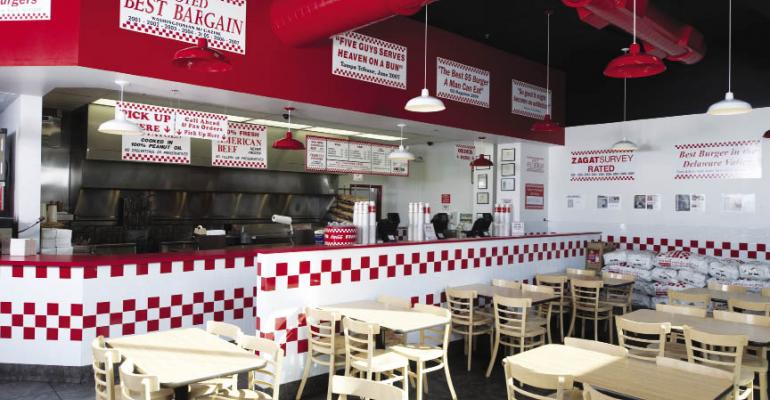
Despite the economic challenges faced by operators in the period covered by the 2010 Top 100 — which stretches from July 2009 through this month — some foodservice entities managed standout performances, such as Five Guys Burgers and Fries of Lorton, Va.
Five Guys not only broke into the ranks of the Top 100 this year, after only a year among Second 100 operators, it also statistically outperformed recently regular “Top 5” achievers Chipotle Mexican Grill and Buffalo Wild Wings Grill & Bar to lead all comers in the contest for highest percentage growth in systemwide sales and unit development. A niche burger player that moved into the mainstream quickly, Five Guys added 171 new restaurants to a base of 377 in the latest year, notching year-over-year growth of 45 percent, while significantly boosting its estimated sales per unit to achieve a near-69-percent bump in system sales to $499.0 million.
Minneapolis-based Buffalo Wild Wings increased its unit count by 16.43 percent and grew systemwide sales by 20.44 percent, to $1.48 billion from 652 casual-dining sports bar restaurants. It claimed runner-up honors for sales and unit growth behind Five Guys and ahead of Chipotle. Denver-based Chipotle, which enjoyed top unit and sales growth honors last year, in its latest year achieved unit and sales increases of 14.23 percent and 13.95 percent, respectively, on its way to ringing up $1.52 billion in sales from 955 fast-casual Mexican-food establishments.
As has been the case in recent years, as mergers and acquisitions activity picked up, many, if not most, of the Top 100 companies cited as Top 5, in terms of year-over-year revenue growth, were the beneficiaries of increases largely reflecting the first full year of ownership of a chain or multiconcept company acquired in the preceding year. That was certainly the case in the latest year for No. 1-rated revenue grower RM Restaurant Holding Corp., with an apparent increase in revenue of 770.6 percent growth, to $458.8 million. Ditto for Nos. 2, 3 and 4: Buffets Restaurants Holdings Inc., Golden Gate Capital and Wendy’s/Arby’s Group Inc. Footnotes at the bottom of the “Top 100 Companies Ranked by U.S. Foodservice Revenue” table explain the situations that resulted in the numbers.
RM Restaurant Holding Corp., for example, acquired from Sun Capital Partners a controlling interest in Real Mex Restaurants late in the preceding year. Real Mex’s portfolio of casual-dining chains includes Chevys Fresh Mex and El Torito, among others. Just Buffalo Wild Wings, alone among the Top 5 companies ranked by revenue growth, managed the feat strictly through year-over-year organic growth of 27.58 percent, to $538.9 million.
Slow growth the new norm
Slower-growing or declining sales or revenue were more commonly experienced in the latest year by the Top 100, statistics gathered from their results indicate.
For example, 40 of the 99 Top 100 companies that had U.S. foodservice revenue in both the latest and preceding years had actual or estimated revenue growth in the latest year, compared with 62 of 95 such operators who reported revenue growth 12 months earlier.
Among Top 100 chains in the latest year, a little more than one in three achieved actual or estimated systemwide sales growth exceeding 1 percent. A year earlier, nearly two in three realized such growth. Further, 40 of 81 chains tracked by estimated sales per unit had growth in that metric in the preceding year, versus just 20 that fell into that camp in the latest.
As a group, Top 100 chains increased their aggregate base of U.S. foodservice establishments by just 0.63 percent in the latest year, to field a total of 194,512 domestic locations in all. That compares with growth of 1.77 percent in the preceding year and the annual new-store development rates of between 3 percent and 5 percent recorded by the Top 100 rosters of 2003 through 2006.
Franchisees move numbers
The franchisees of Top 100 chains continued to fuel unit growth in the latest year, as they did in the preceding period. In the latest year they increased their base of restaurants by 2.1 percent, or by 2,551 units, to 125,429 locations. At the same time, franchisors or nonfranchisee restaurant owners within the Top 100 closed or sold off to franchisees 1,330 locations, or about 1.89 percent of their total base, to end the year with an aggregate 69,083 units.
In a twist on the recently common practice among some chain parents, including Jack in the Box Inc. and Sonic Corp., of selling off or “refranchising” corporate stores to franchisees in an effort to capitalize on underutilized assets, reduce operational complexity and increase higher margin royalty income, Waffle House Inc. went on a buying binge. The Norcross, Ga.-based operator and franchisor of namesake family restaurants, during the fiscal year ended in May, increased its preceding-year base of 825 restaurants by nearly 40 percent by opening a net 45 new locations and acquiring 279 units from franchisees, including 146-unit Northlake Foods Inc. of Brandon, Fla., and 113-unit Southeast Waffles LLC of Nashville, both of which had earlier filed for bankruptcy.
McDonald’s still king
Oak Brook, Ill.-based McDonald’s showed that while significant unit growth is nice, it is not always needed to boost sales in a meaningful way. The chain ended its latest fiscal year with 13,980 U.S. restaurants, up 62 units, or 0.45 percent from the preceding year.
Yet the chain operated by and franchised to others by McDonald’s Corp. managed to couple that small store-count growth with improved unit-level performance in the form of a 3.05-percent increase in estimated sales per unit, to boost its domestic systemwide sales total by more than $1 billion to $31.03 billion for the year.
With that 3.49-percent systemwide sales run-up, McDonald’s maintains its status as the biggest single foodservice brand in the United States.
Its closest rival, Milford, Conn.-based Subway, despite enjoying a year-over-year rise in sales of 3.75 percent, to $9.99 billion, nonetheless remains nearly $21 billion behind.
The other top five chains, in terms of sales, all of which had lower actual or estimated latest-year sales, were Burger King, Wendy’s and Starbucks, with domestic systemwide sales of $8.88 billion, $7.92 billion and $7.42 billion, respectively.
DineEquity’s Applebee’s Neighborhood Grill & Bar chain, with latest-year U.S. systemwide sales of $4.37 billion, down from $4.49 billion a year earlier, was the highest ranked casual- dining chain, at No. 10. It was just ahead of Brinker International’s Chili’s Grill & Bar, with the No. 11 ranking and estimated systemwide sales of $4.0 billion for the year ended this month, and Olive Garden, No. 13, with estimated latest-year domestic systemwide sales of $3.37 billion.
Darden Restaurants, of Orlando, Fla., parent to the Olive Garden, Red Lobster and LongHorn Steakhouse chains, among others, remained the No. 2-ranked Top 100 company — with an increase of 0.45 percent in estimated U.S. foodservice revenue, to $7.16 billion, for the fiscal year ended in May — behind London-based contract foodservice provider Compass Group PLC. Charlotte, N.C.-based Compass Group North America, with such contract operations as Eurest Dining Services, Chartwells, Restaurant Associates, Bon Appetit Management Co. and Levy Restaurants sports concessions, saw its estimated U.S. foodservice revenue climb by 2.27 percent, to $7.89 billion, for its latest year, ended last September.
Rounding out the top five Top 100 companies were contract foodservice provider Aramark Holdings Corp. of Philadelphia, with estimated U.S. foodservice revenue of about $6.3 billion in the latest year, down from $6.74 billion a year earlier; Starbucks Corp. of Seattle, which saw its estimated domestic food-and-beverage revenue fall from about $6.49 billion in the preceding year to about $6.15 billion in the latest; and Sodexo, the Paris-based contract company, whose U.S. operations had flat estimated domestic food-and-beverage sales of $5.66 billion in its latest year ended last August.
To purchase the full Top 100 2010 report in PDF form, click here.
Contact Alan J. Liddle at [email protected]

