1 9
1 9
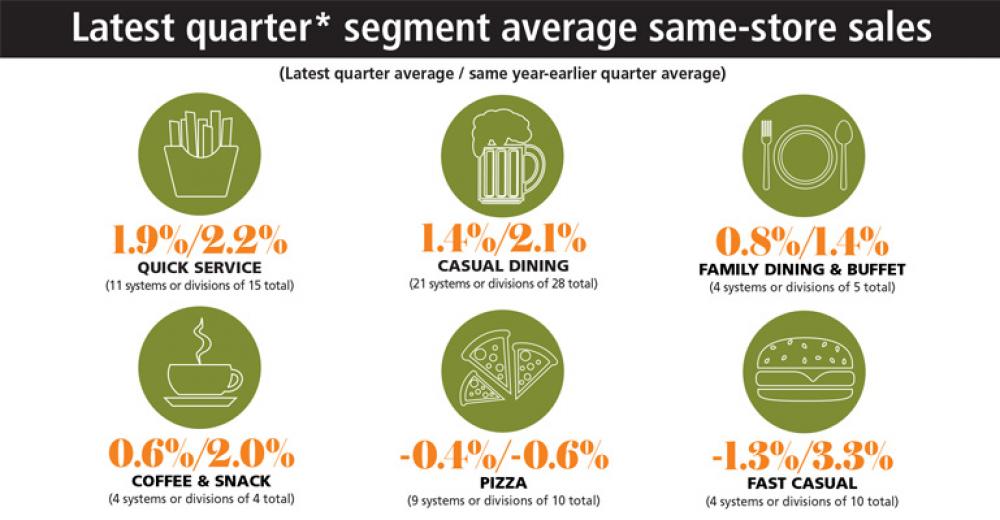
*Among systems or divisions with latest reported quarters ended closest to Dec. 31, 2018, or between Nov. 25, 2018, and Jan. 20, 2019; excludes Popeyes Global results.
*Among 53 systems or divisions with latest reported quarters ended closest to Dec. 31, 2018, or between Nov. 25, 2018, and Jan. 20, 2019; excludes Popeyes Global results.
**Preliminary result.
*Reflects multi-year average annual same-store sales for 37 systems or divisions whose most recent reported quarter ended closest to Dec. 31, 2018, or between Dec. 25, 2018, and Jan. 1, 2019, and concluded a fiscal year. Sixteen systems or divisions with similar fiscal year year-ends had not reported or had their results tallied as of the close of this same-store sales research cycle. Excludes Popeyes global results.
*Latest quarter same-store sales change combined with change for same quarter a year earlier among 65 systems or divisions with quarters ended closest to Dec. 31, 2018, or between Nov. 25, 2018, and Feb. 1, 2019; excludes Popeyes’ global results.
*Latest quarter same-store sales change combined with change for same quarter a year earlier among 65 systems or divisions with quarters ended closest to Dec. 31, 2018, or between Nov. 25, 2018, and Feb. 1, 2019; excludes Popeyes’ global results.
Yum! Brands‘ Pizza Hut U.S. division reported fiscal year 2018 same-store sales growth of 2% that represented solid improvement from 2017’s 2% dip and compared favorably with full-year comps setbacks of 7.3% and 2.5% at Papa John’s and Papa Murphy’s, respectively. However, Domino’s Pizza Inc.’s U.S. division’s 6.6% annual same-store sales improvement was a tough comparison for Pizza Hut and raised Domino’s four-year annual comps growth stack to 36.8%, versus Pizza Hut’s 1% stack.
Bonefish Grill, from Bloomin’ Brands Inc., may have seen fourth-quarter same-store sales fall 1.1%, but its full-year improvement of 0.5% ended three years of negative annual comps. Sister brand Carrabba’s Italian Grill saw a 0.2% fiscal 2018 same-store sales improvement to halt a five-year string of declines, and Fleming’s Prime Steakhouse & Wine Bar managed a 0.8% annual gain to counter two years of downturns. Two years of comps erosion was also ended by BJ’s Restaurants Inc. and Dine Brands Global Inc.’s Applebee’s Neighborhood Grill & Bar, with fiscal 2018 same-store sales gains of 5.3% and 5.0%, respectively.
Texas Roadhouse Inc.’s namesake company and franchised restaurants regularly lead the casual-dining pack in same-store sales growth, and did so again in the quarter ended Dec. 25, with comps increases of 5.6% and 4.8%, respectively. Company executives in the past have credited comps and traffic growth, in part, to a conservative approach to menu price increases, but raised prices 1.7% late last year and said they will increase them another 1.5% during the first quarter to protect margins.
Biglari Holdings Inc. reported company Steak ‘n Shake restaurants’ same-store sales were off 5.1% for the year ended Dec. 31, compared with annual comps decreases of 1.8% and 0.4% in 2017 and 2016, respectively. In a shareholder letter, chief executive Sardar Biglari said the company, by not updating equipment and kitchen designs, “failed customers by not being fast and friendly.” As a result, he continued, “we are determined to implement advanced production techniques” and improve service and hospitality by franchising all company-managed units to “owner-operators.”

