In case you didn’t catch it last month, supply chain pressures for foodservice have been easing substantially over the last several months as reflected in the Datum FS Foodservice Supply Chain Stress Index. This index is made up of various data points including commodity inflation, supply chain labor inflation, foodservice sales growth, domestic freight markets and inputs from the New York Feds overall supply chain pressure index, including world trade. As the chart shows, the index in March declined to its lowest level since the fall of 2020. In other words, supply chain pressures continue to ease, which is certainly good news for the industry.
One major factor that has not eased is labor within the foodservice supply chain. For those keeping score, the average hourly wage in the foodservice supply chain is tracking 5.3 percent above year-ago levels, which is the second strongest in recent history. Further, the labor supply in the supply chain is fairly limited. Sure, total labor in the supply chain is about on par with January 2020 (think pre-COVID). However, foodservice sales are up substantially since then, forcing the industry to do more with less. Necessity is the principal driver of this due to higher wages and a tighter labor supply, which adds risk to operations. The supply chain is getting smarter, however, and will get even more efficient with data-driven tech adoption. Just saying.
One major factor that has eased is (drum roll please) commodity prices. In March, the Datum FS Foodservice Commodity Index was nearly 16 (think Whitey Ford) percent lower than the prior year. This has been led by sharp declines in many commodities like chicken (more on this in a moment) and pork products, including everybody’s favorite: bacon. Yes, the commodity markets firmed during the winter, but that is not unusual. As a matter of fact, and you know I love those, the index rose just under 5 percent this winter, marking the smallest increase for the time period since at least 2016 not including 2020 (COVID). So yes, commodity prices have risen in recent months, but those gains have been tempered.
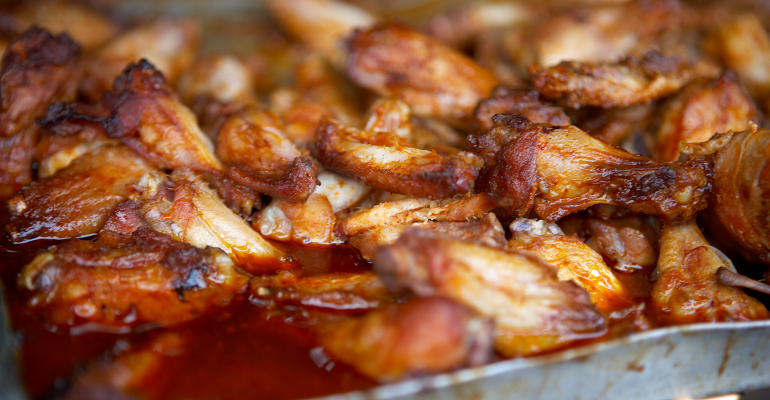
Now, back to chicken. As I noted, the chicken markets have tracked well below year-ago levels so far this year. For those who may not be familiar with the chicken markets, breast prices climbed north of $3 a pound last year only to fall south of $1 by November. Although chicken wings were on the rise earlier this year, recently they have crashed like No. 1 seeds in the NCAA women’s and men’s basketball tournaments. The USDA whole chicken wing market has declined just over 11 percent since peaking at the beginning of March, which is usually accompanied with a surge in demand for the NCAA basketball tournaments. So what's the deal with the wing markets?
As readers can tell, the discount in the bone-in wing market to chicken breast is about as normal as having three first-timer teams in the NCAA men's Final Four. But part of this goes back to 2021, when wing prices averaged at record levels near $3 per pound and more than a buck above chicken breasts. The incentive at that time was to move away from bone-in wings to other protein features, including boneless wings (think chicken breast). But look for that to change as the incentive has shifted. Wouldn't surprise me, my mother or Dick Vitale if wing prices climbed above breasts later this year. After all, bone-in wings are "awesome baby!"
AUTHOR BIO
David Maloni is the Principal of Datum FS, a foodservice supply chain consultancy featuring his three decades of experience working with the majority of the top 500 restaurant brands. Datum FS assists companies with commodity forecasts, market baskets and supply chain data management best practices. For more information email [email protected].


