

On a regular basis, the U.S. government measures the rate of price change throughout the country in all industries, including the restaurant and grocery sectors.
As restaurant owners and executives, this data is one of many metrics to review that can be used to compare price changes in your organization with price changes of the restaurant industry, as well as grocers. The data can also shed light on the competitive landscape.
The U.S. Bureau of Labor Statistics (BLS) produces two indices related to the restaurant industry: Food Away From Home (FAFH) and Food At Home (FAH). FAFH measures the price of eating out, from quick-service to fine-dining establishments. FAH is the grocery index. It encapsulates food purchased from grocery stores (or other food stores), and food prepared by the consumer unit on trips.
Both indices provide important data for the restaurant industry that operators should understand. Reviewing FAFH data for your region helps you understand where your price changes fit among traditional restaurant competitors, while FAH tells you if you are also competing with non-traditional competitors (i.e. the refrigerator).
But while it’s important to pay attention to these indices, there are some caveats to keep in mind as you review the statistics.
Try to take as detailed a look as possible at FAFH data. It’s important not only to look at the overall index, but also to review the specific data for your region and segment if it’s available and appropriate.
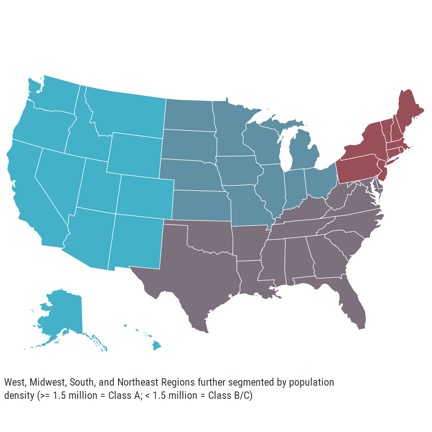 The Bureau of Labor Statistics releases new information on a monthly basis for four U.S. regions: West, Midwest, South and Northeast; and the data is further subdivided by population density, separating areas of more than 1.5 million from those with fewer than 1.5 million (8 regions total based on this criteria). Furthermore, 14 major metropolitan areas are also reported on a regular basis. These figures are updated monthly or bi-monthly, so make sure you’re looking at the latest information.
In addition to regional figures, you could also look at the figures for your segment of the restaurant industry. However, these are only available at the national level. BLS breaks down FAFH segments as follows: full service (table service), limited service (quick service and takeout), employee sites and schools (cafeterias), and vending machines and mobile.
Understand how your organization might affect the index. If your organization is the dominant player in a segment or region, you may want to look at a broader view of the indices. Otherwise, if you only look at your segment, you’d be making comparisons in large part to your own organization, and of course, that isn’t very helpful.
The information is broad and might not capture the restaurants down the street from your location. While the indices break down by region and segment, they are likely not as granular or micro as you may like. It’s a fixed basket of goods that are shopped each month and you don’t know which products are shopped, how often the products are switched out, or if a new product or a brand-specific item is being shopped. And you don’t know how all of these factors affect the index.
For example, one of our consultants recently noticed an anomaly in the Atlanta metropolitan data. The Atlanta FAFH data had grown tremendously over recent months, much more so than other regions. After contacting the BLS regional office in Atlanta, it was determined that one restaurant in that market had a change in ownership, and with that raised prices dramatically. Because the Atlanta metropolitan market is a smaller subset, those price changes made a big enough impact to change the index.
For a good indicator of what is happening in your market, you also have to shop your competitors. If you want to know for certain where your competitors are priced at, you have to shop them yourself. This tactic also tells you if competitors are doing something to undercut your prices, if they are charging the same, or if they are making price changes before or after you. And you can’t rely on the prices a chain is advertising because those are often national advertisements and many local franchisees are able to operate autonomously.
Don’t forget to check FAH. Although we think of restaurants generally competing with other restaurants, in today’s environment, grocery continues to add new take-home offerings like deli sandwiches, rotisserie chicken, pre-made salads, etc. While your price changes might be competitive with other restaurants in your area, it’s also good to have a pulse on where you stand versus the grocery store.
Even with the aforementioned caveats, these indices are the best publicly available data for what is going on in the industry related to prices. Knowing what is going on in the competitive environment can help you better gauge what’s realistic as far as combating cost pressures, like minimum wage, with price increases.
For example, the national forecasts provided by the USDA’s Economic Research Service for FAFH and FAH in 2016 is 2.5 percent to 3.5 percent and 1 percent to 2 percent, respectively. If you find that you’d need price changes above 5 percent, for example, to offset upcoming cost pressures, this data signals that this will only be achievable if your restaurant can sustain additional price increases based on your customers’ willingness to pay. Depending on your perceived brand value, you may have to look to other areas within the business to offset those pressures (i.e. getting more customers in the door and/or cost-saving measures like decreasing waste or altering staffing levels).
The best way to know if you’re doing a good job with managing menu pricing is to review transactional data so you can have a deep understanding of how pricing impacts customer traffic and how it affects customer spending at your restaurants.


